¶ 💼 Manage Deals
The Deals management page in SysRI CRM provides a comprehensive overview of all your deals, their risk levels, and key metrics. This powerful tool allows you to track, analyze, and manage your sales pipeline effectively.
Companies Overview
¶ 🧭 Quick Navigation
- 📊 Risk Distribution Overview of deal risk levels and total value
- 📅 Deal Views Different ways to analyze your deals
- 📋 Deals Table Comprehensive list of all deal information
- 🔄 Deal Stage Management Visual tool for updating deal progress
- 🤖 AI Deal Insights AI-powered analysis and risk assessment
- 🛠️ Action Icons Quick access to common deal actions
- 💡 Pro Tips Best practices for effective deal management
¶ 📊 Risk Distribution
The Risk Distribution section provides a quick visual overview of your deals categorized by risk level. This information is crucial for prioritizing your sales efforts and managing potential risks in your pipeline.
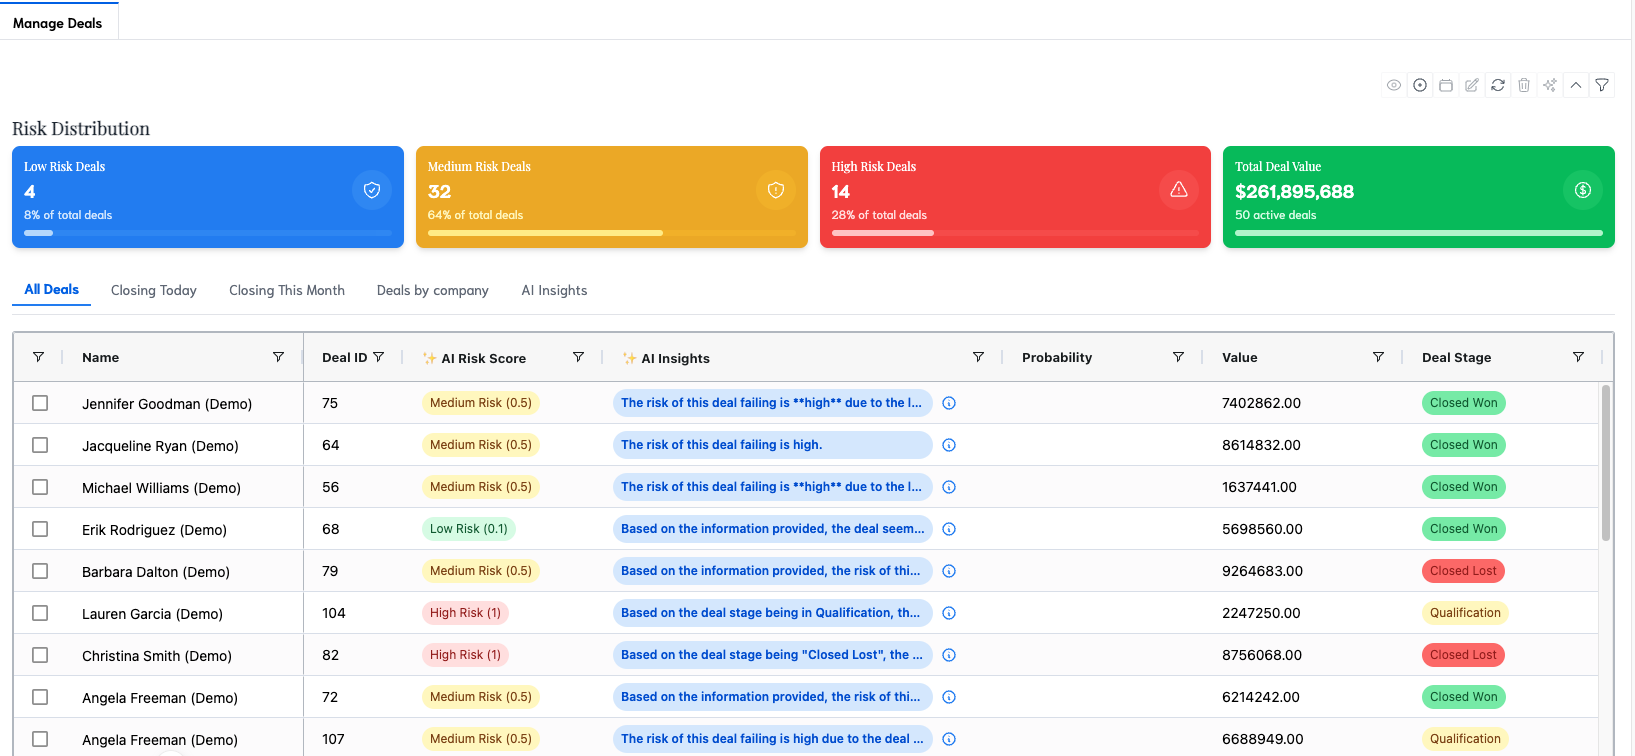
¶ Low Risk Deals
- Count: 4
- Percentage: 8% of total deals
- 🔵 Blue color-coded
Description: Low Risk Deals represent opportunities that are highly likely to close successfully. These deals typically have strong buyer engagement, clear decision-making processes, and align well with your product or service offerings.
Importance:
- Indicates deals that may require less intensive management
- Helps in forecasting more reliable revenue
- Can be used as case studies or references for other potential clients
¶ Medium Risk Deals
- Count: 32
- Percentage: 64% of total deals
- 🟠 Orange color-coded
Description: Medium Risk Deals are opportunities that have potential but face some challenges or uncertainties. These might include deals with longer sales cycles, multiple decision-makers, or moderate competition.
Importance:
- Represents the bulk of your pipeline, requiring balanced attention
- Identifies deals that may need additional resources or strategies to move forward
- Helps in prioritizing which deals need more nurturing to reduce their risk level
¶ High Risk Deals
- Count: 14
- Percentage: 28% of total deals
- 🔴 Red color-coded
Description: High Risk Deals are opportunities facing significant challenges that may prevent them from closing successfully. These could include deals with budget constraints, strong competition, or unclear decision-making processes.
Importance:
- Highlights deals that need immediate attention or reassessment
- Helps in identifying common factors that increase deal risk
- Guides decision-making on whether to continue pursuing these opportunities or reallocate resources
¶ Total Deal Value
- Value: $261,895,688
- Active Deals: 50
- 🟢 Green color-coded
Description: The Total Deal Value represents the cumulative potential revenue from all active deals in your pipeline. This metric provides an overview of your sales pipeline's overall health and potential financial impact.
Importance:
- Offers a quick snapshot of potential revenue
- Helps in setting and tracking sales targets
- Provides context for individual deal values
- Assists in resource allocation decisions based on pipeline value
Key Insight: With 50 active deals totaling over $261 million, each deal is worth an average of $5.2 million. This high average deal value suggests a focus on high-value clients or contracts.
By regularly monitoring these risk distribution metrics, sales teams can:
- Prioritize their efforts on deals most likely to close
- Identify trends in deal risk over time
- Develop strategies to mitigate risks and move deals to lower risk categories
- Make data-driven decisions about resource allocation and sales strategies
- Provide more accurate sales forecasts to leadership
Remember, the goal is to increase the number of Low Risk Deals while decreasing High Risk Deals, all while maintaining or growing your Total Deal Value.
¶ 📅 Deal Views
The Deals page offers multiple views to analyze your deals:
- All Deals: Default view showing all deals in the system
- Closing Today: Deals expected to close on the current date
- Closing This Month: Deals with expected closure within the current month
- Deals by company: Grouped view of deals organized by client companies
- AI Insights: AI-powered analysis and recommendations for your deals
¶ 📋 Deals Table
The main deals table uses AgGrid for powerful data management, offering a comprehensive view of all deals in the system. The table is divided into two main sections, providing detailed information about each deal.
¶ Columns
-
Name: Deal name or client name (e.g., Jennifer Goodman (Demo))
-
Deal Status: Current status of the deal (e.g., In Progress, Converted, Closed Won)
-
Expected Close Date: Anticipated date for deal closure (e.g., 2025-07-13)
-
Owner: The sales representative responsible for the deal (not visible in the image)
-
Company Name: The company associated with the deal (e.g., Microsoft (Demo))
-
Website: Official website of the company (e.g., https://www.microsoft.com)
-
Address: Physical address of the company (e.g., One Microsoft Way)
-
Phone: Contact number for the company (e.g., +1 425-882-8080)
-
Region: Geographical region of the deal (e.g., North America)
-
Country: Country where the deal is taking place (e.g., United States)
-
State: State or province within the country (e.g., Washington)
-
Lost Reason: If applicable, reason for losing the deal (empty in the provided image)
-
Created At: Timestamp when the deal was created in the system (e.g., 2025-05-14T22:55:37.291726Z)
-
Updated At: Timestamp of the last update to the deal (e.g., 2025-06-14T04:23:46.432147Z)
¶ Features
- Sortable columns (indicated by ▼ icons)
- Filterable data (indicated by 🔍 icon in column headers)
- Selectable rows for bulk actions
- Color-coded risk scores and deal stages for quick visual assessment
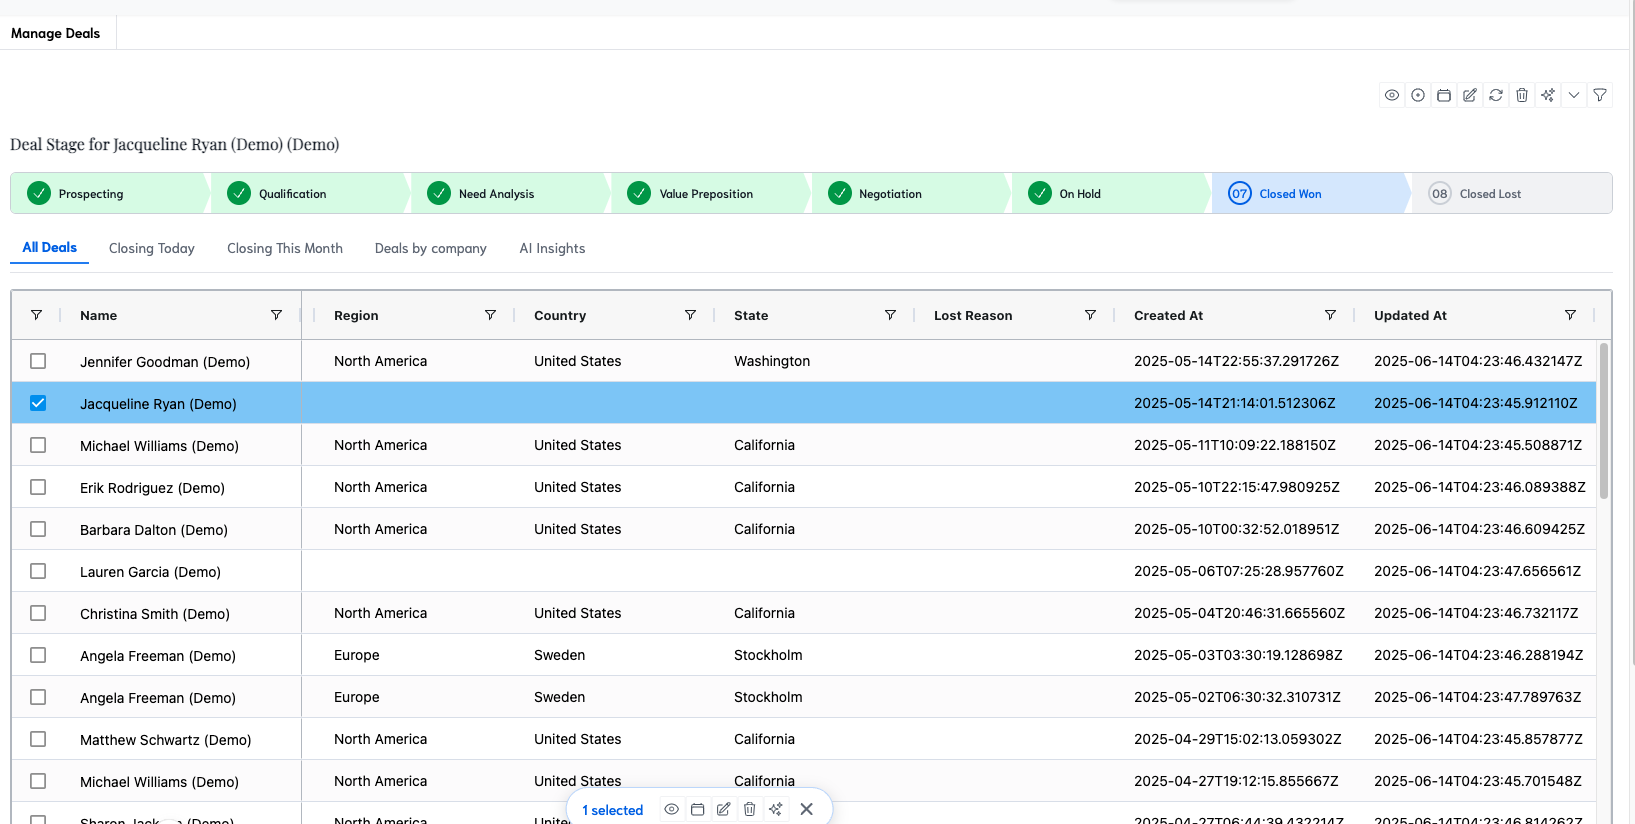
¶ Deal Stage Management
When a deal is selected, a visual representation of the deal stages appears, allowing for quick assessment and easy updates of the deal's progress.
¶ Deal Stage Bar
The deal stage bar is displayed prominently when a deal is selected, showing the current stage and all possible stages in the sales pipeline.
Stages typically include:
- 🆕 New
- 👋 Attempting Contact
- 🤝 Engaged
- 💼 Qualified
- 📝 Contract Sent
- 🎉 Closed Won
- 😞 Closed Lost
¶ Changing Deal Stages
Users can update a deal's stage directly from this view:
- Click on the desired stage in the deal stage bar.
- The stage updates immediately, reflecting the new status in the system.
- The deal's row in the table will update to show the new stage.
¶ Benefits of Visual Stage Management
- Quick Updates: Change stages with a single click, streamlining the sales process.
- Clear Visualization: Easily see where each deal stands in the pipeline.
- Progress Tracking: Quickly identify deals that are moving forward or stalling.
- Standardized Process: Ensures all team members follow the same sales stages.
¶ Stage-Specific Actions
Each stage may have associated actions or requirements:
- New: Initial information gathering and lead qualification.
- Attempting Contact: Logging outreach attempts and scheduling initial meetings.
- Engaged: Recording key points from customer interactions and identifying needs.
- Qualified: Documenting specific requirements and preparing proposals.
- Contract Sent: Tracking document sends and managing negotiations.
- Closed Won: Initiating onboarding processes and setting up for success.
- Closed Lost: Logging reasons for loss and identifying improvement areas.
By utilizing this visual stage management system, sales teams can:
- Maintain an up-to-date and accurate sales pipeline.
- Quickly identify which deals need attention or are ready to move forward.
- Ensure consistent deal progression across the entire sales team.
- Provide clear visibility into the sales process for managers and executives.
This feature combines the power of detailed data management with intuitive visual controls, enabling efficient and effective deal management throughout the sales cycle.
¶ Detailed AI Insights
The AI Insights tab provides in-depth analysis for each deal:
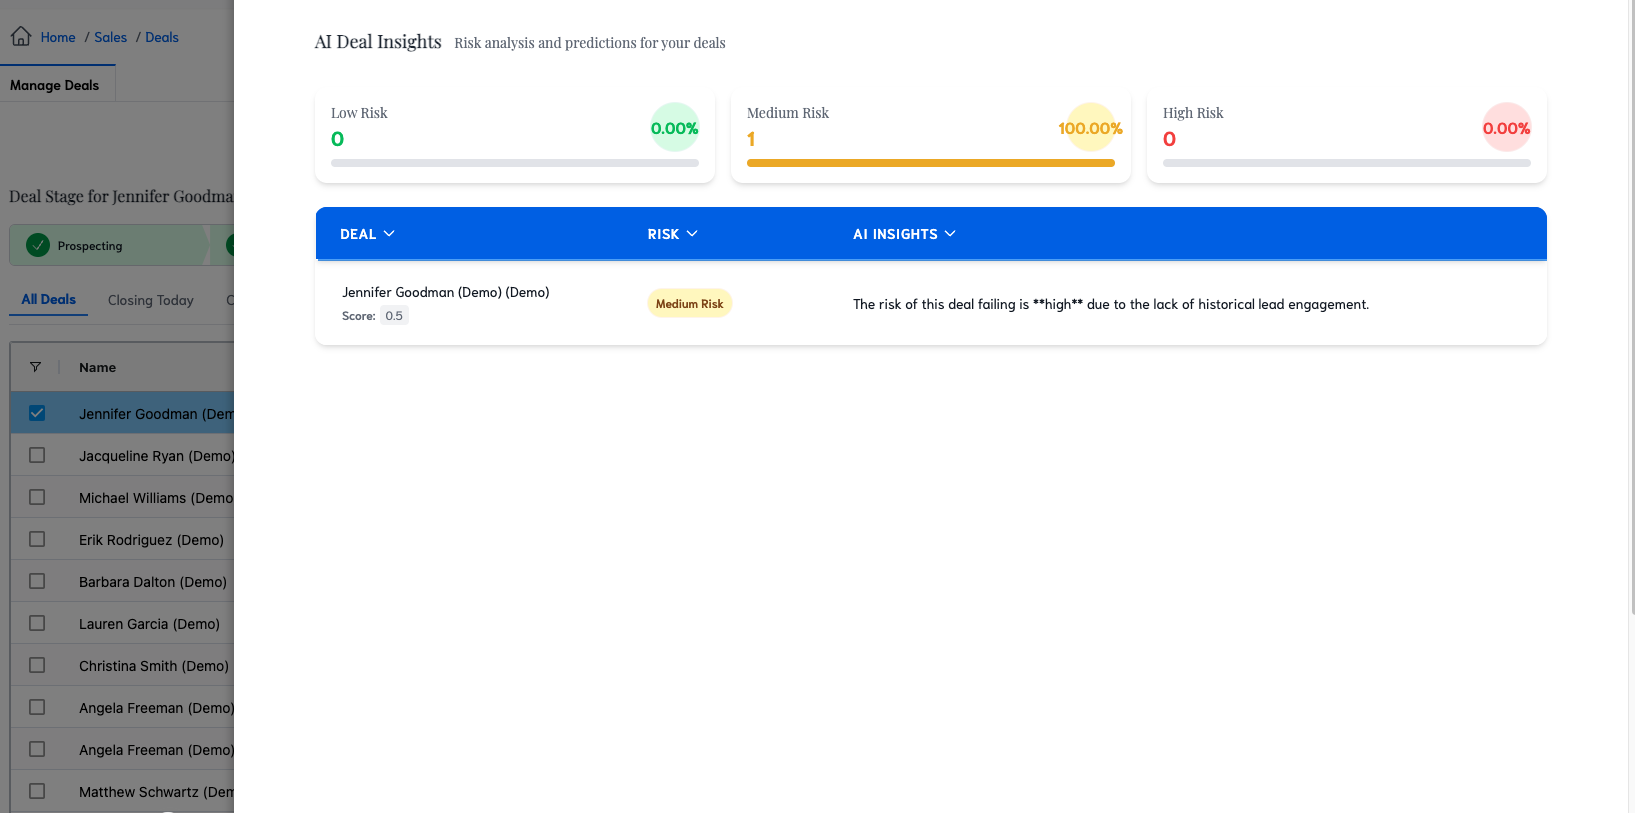
¶ Deal Information
- Deal Name: e.g., "Jennifer Goodman (Demo) (Demo)"
- Risk Score: Numerical value (e.g., 0.5)
- Risk Category: Visual indicator (e.g., "Medium Risk" badge)
¶ AI Risk Assessment
The AI provides a concise risk evaluation for each deal. For example:
"The risk of this deal failing is high due to the lack of historical lead engagement."
This insight helps sales representatives understand:
- The AI's assessment of the deal's risk level
- Key factors contributing to the risk assessment
- Areas that may need attention to improve the deal's chances of success
¶ Benefits of AI Deal Insights
- Data-Driven Decision Making: Leverage AI analysis to prioritize deals and allocate resources effectively.
- Early Risk Detection: Identify potential issues before they become critical, allowing for proactive management.
- Standardized Risk Assessment: Ensure consistent evaluation of deals across the sales team.
- Performance Improvement: Use AI insights to refine sales strategies and improve overall win rates.
- Time Efficiency: Quickly understand the status and needs of each deal without manual analysis.
¶ How to Use AI Insights
- Regularly review the Risk Distribution to understand your overall pipeline health.
- Click on individual deals to view detailed AI insights.
- Pay special attention to the factors the AI identifies as contributing to risk.
- Develop action plans to address specific risks highlighted by the AI.
- Track how changes in deal management affect the AI risk assessment over time.
¶ Important Notes
- The AI's assessments are based on historical data and patterns, and should be used in conjunction with human expertise.
- Continuously provide feedback and update deal information to improve the accuracy of AI insights over time.
- Use the AI insights as a starting point for deeper analysis and strategy development, not as a replacement for critical thinking and relationship building.
¶ 🛠️ Action Icons
The top-right toolbar provides quick access to various actions:
- 👁️ View: Open detailed view of selected deal(s)
- 🔄 Refresh: Update the deals list with the latest data
- 📤 Export: Export deal data (likely CSV or Excel format)
- 📝 Edit: Modify details of selected deal(s)
- 🗑️ Delete: Remove selected deal(s) from the system
- 📊 Reports: Generate reports based on deal data
- ✨ AI Actions: Access AI-powered features or insights
- ⬆️ Expand: Maximize the deals view or enter full-screen mode
- 🔍 Filter: Apply advanced filters to the deals list
¶ 💡 Pro Tips
- Regularly review the Risk Distribution to identify trends in your deal pipeline.
- Use the AI Risk Score and Insights to prioritize your sales efforts.
- Leverage the different deal views (Closing Today, This Month) for time-sensitive follow-ups.
- Export deal data regularly for offline analysis or reporting.
- Utilize the AI Insights view to gain deeper understanding of your sales pipeline and potential areas for improvement.
- Keep deal stages updated to maintain an accurate sales forecast.
- Use bulk actions (select multiple deals) for efficient pipeline management.
- Customize your view by hiding/showing columns as needed for your specific role or focus.
By effectively using the Deals management page, you can maintain a clear overview of your sales pipeline, identify high-priority deals, and make data-driven decisions to improve your sales performance.